 By
By 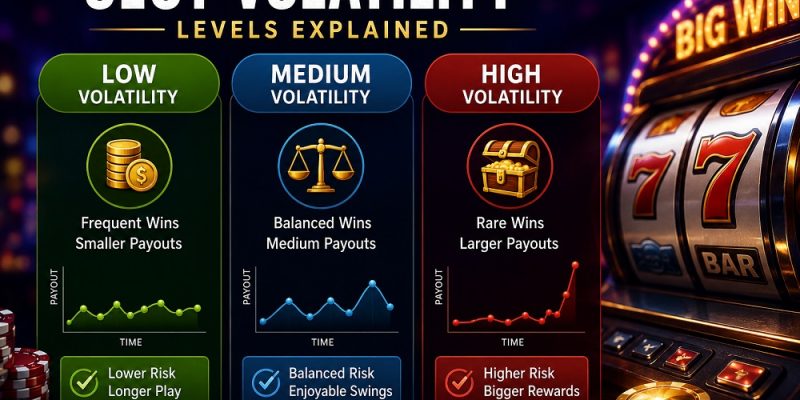
The 60-Second Answer: RTP Is the Mean, Volatility Is the Spread
Volatility is the standard deviation of a slot’s payout distribution, not a vibe or a marketing sticker. Low volatility clusters wins tightly around small, frequent amounts (30%–50% hit frequency). High volatility spreads that same statistical energy across rare, large outliers (often under 10%–20% hit frequency, with max wins of 5,000x–10,000x+). Two slots can post an identical 96% RTP and still be mathematically unrelated in how they distribute that 96% — RTP is the mean, volatility is the spread around it.
Why a Paytable Is Secretly a Probability Curve
What RTP Testing Labs Actually Measure
Every slot’s paytable is a probability distribution: a list of outcomes and the odds of hitting each one. RTP is that distribution’s expected value — the average, calculated over millions of simulated spins by testing labs like GLI or eCOGRA. Volatility is the distribution’s standard deviation: how far individual outcomes typically stray from that average. A low-volatility game has a tight, short-tailed distribution — most spins land close to the mean. A high-volatility game has a long right tail — the vast majority of spins land at zero, with the expected value dragged upward by rare, enormous outliers.
This is why providers rate volatility on arbitrary internal scales rather than a single industry standard: Pragmatic Play uses 1–5, Nolimit City uses 1–10 and has pushed specific titles as high as 12. There’s no regulatory body standardizing these scales, so a “5” on one provider’s system is not guaranteed to match a “5” on another’s — the number is a relative signal within that studio’s own catalog, not an absolute unit.
Same RTP, Opposite Session
Take two slots that both carry a 96% RTP. Slot A (low volatility) might return roughly $0.90–$1.00 on 40% of $1 spins — a $100 session sees dozens of small hits and likely ends within 20% of where it started. Slot B (high volatility) might return $0 on 250 straight $1 spins, then land a single 500x hit worth $500. Both games pay back 96% of everything wagered across millions of spins — but only one of them lets a player walk away from a single $100 session having seen any win at all.
What Each Distribution Shape Actually Delivers
- Low volatility: tight distribution means predictable session length — useful for meeting a casino bonus’s wagering requirement without excess bankroll risk.
- Low volatility: fewer, shorter zero-win stretches, which keeps engagement steady rather than spiking and crashing.
- Medium volatility: the distribution’s tail is long enough to produce a genuinely surprising win occasionally, without the multi-hundred-spin dry stretches that define high volatility — most mainstream video slots are tuned to this band deliberately.
- High volatility: the only category mathematically capable of the largest multiplier outcomes (5,000x–10,000x+), since a short-tailed distribution structurally cannot produce them.
- High volatility: bonus-buy mechanics let a player pay to skip directly to the tail of the distribution instead of grinding the base game toward it.
Where Each Distribution Shape Breaks Down
- Low volatility: the distribution’s tail is short by design — no amount of session length converts a low-volatility game into a big-win opportunity.
- Medium volatility: still requires a real bankroll buffer (roughly 150–300x the bet) since its variance is meaningfully wider than low volatility’s, even if it feels “balanced.”
- High volatility: a long right-tailed distribution means most individual sessions will sample the zero-heavy left side of the curve — 100–300+ spins with no meaningful return is the statistically normal outcome, not an anomaly.
- High volatility: undercapitalized bankrolls mathematically bust before reaching the tail more often than not, since bust risk compounds every spin the tail hasn’t hit yet.
- Unstandardized scales: a provider’s self-assigned volatility number isn’t independently audited the way RTP typically is, so cross-provider comparisons based on the number alone are unreliable.
Where Players Misread the Curve
- Treating volatility and RTP as the same variable. They’re mathematically independent — a slot’s payback percentage says nothing about how that payback is distributed.
- Interpreting a 200-spin dry stretch on a high-volatility game as evidence the game is “broken” or “due,” when it’s simply sampling the expected shape of a long-tailed distribution — the game has no memory of prior spins.
- Sizing a bankroll the same way across volatility levels. The same $200 supports a very different number of realistic sessions on a low- vs. high-volatility title.
- Comparing a provider’s self-rated volatility number directly across providers, without accounting for the fact that these scales are internal and unstandardized.
- Increasing bet size mid-dry-spell on a high-volatility slot to “force” a hit — this accelerates bust probability rather than shifting the underlying distribution in your favor.
Building a 200-Spin Volatility Audit of Your Own
- Open demo mode and fix your bet size. Use a flat, unchanging stake for the entire test so your results aren’t distorted by bet variance.
- Log every spin’s outcome for 150–200 spins. A simple win/loss/amount column in a spreadsheet is enough — you’re building a small sample of the distribution.
- Calculate your hit frequency. Divide winning spins by total spins. Under 20% suggests high volatility; 20%–30% suggests medium; over 30% suggests low.
- Check your largest single win against your total wagered. A largest win under 20x your bet across 200 spins points to low/medium volatility; a single win exceeding 100x points to high volatility even with a low hit count.
- Cross-check against the game’s stated rating. If your sample contradicts the provider’s label significantly, treat the label with more skepticism going forward — labels are marketing copy, not audited certificates.
Questions the Spreadsheet Doesn’t Answer
Is volatility literally a standard deviation calculation?
Functionally, yes. Testing labs simulate millions of spins and measure how far individual outcomes deviate from the average return — that spread is what gets translated into a low/medium/high or numeric volatility label.
Why do provider volatility scales differ (1–5 vs 1–10)?
There’s no regulatory standard forcing providers to use the same scale. Each studio sets its own internal range, so the number is only meaningful relative to that provider’s own catalog, not as a universal unit.
Can I calculate a game’s real volatility from a small number of spins?
Not precisely — true volatility is derived from millions of simulated spins. But 150–200 logged spins is enough to sanity-check hit frequency and spot whether a game’s real behavior roughly matches its stated rating.
Does a long dry spell mean a high-volatility slot is ‘due’ for a win?
No. Each spin is statistically independent; the game has no memory of prior outcomes. A 200-spin dry stretch is simply consistent with the shape of a long-tailed distribution, not evidence of an upcoming win.
Which volatility level is best for a small bankroll?
Low or low-to-medium volatility generally suits a small bankroll best, since its tighter distribution reduces the odds of a full bust before the session naturally ends.
Playing the Shape of the Curve, Not the Streak
Volatility is a statistical property of a paytable’s distribution — the spread around RTP’s average — not a difficulty setting or a feel-based label. Understanding it as standard deviation rather than marketing language changes how you size bets, set bankrolls, and interpret dry spells: a 200-spin losing stretch on a high-volatility game isn’t bad luck defying the math, it’s the math working exactly as designed. Match your bet size and bankroll to the distribution’s actual shape, log your own sample if you want to verify a provider’s rating, and treat every volatility figure as a guide to risk and entertainment value rather than a prediction of what any single session will do. Set a budget before playing, not during a streak.







Comments